Text VisualizeR
Realise the Power of your Text Data!
- Have you ever struggled to get meaningful insight or discover patterns in your text data?
- Do you find visualizing the relationship between words in large datasets difficult?
- Are you looking for an intuitive app that goes above and beyond for text analysis and provides deep insights without having to code?
Then Text VisualizeR from Qi Statistics Ltd. is the answer! It is easy to use and has been designed for anyone, whether you are a scientist, researcher, panel leader, manager, analyst or statistician! With just a few clicks you can transform raw text data into insightful visualisations and comprehensive analysis.
With Text VisualizeR you can seamlessly import your text data and generate customisable outputs. In these outputs, you can specify what specific data from your dataset you wish to see, such as which products you want to compare the data of for product reviews. Once you are happy with the output you can export the resulting pictures in an easy-to-use format (.csv and .png files). Tables of data can be exported to Excel and graphs can be exported into editable Powerpoint files, saving you time on preparing your reports.
You get to customise how the analysis handles your data, by adding or removing phrases and stop words and the software can remember your customisations so you don’t have to keep setting it up every time.
Have a play with the software using our free demo version available by clicking on the button below – you get full access to all features but limited to the demo pre-loaded dataset.
Main Features
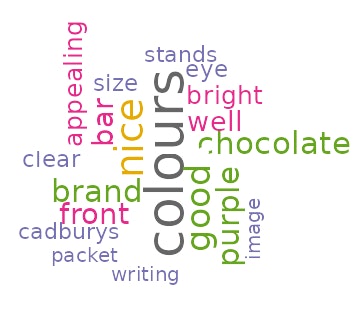
- Word Clouds: Create word clouds to highlight the most prominent terms in your text data.
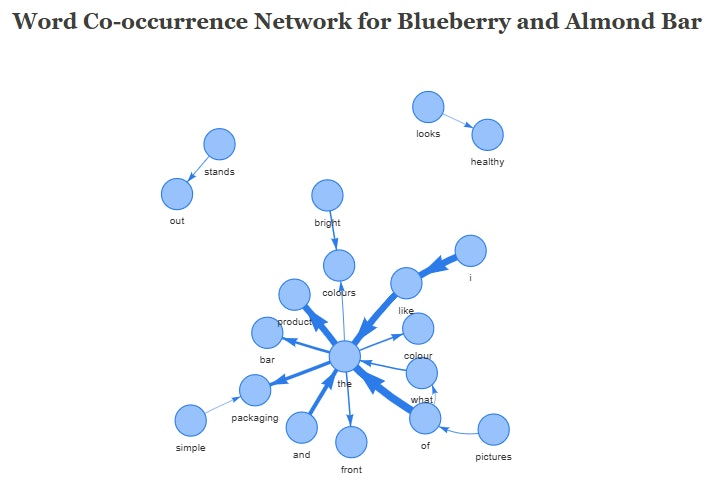
- Word Co-occurrence Networks: Visualize connections between words and discover which words frequently appear together as phrases.
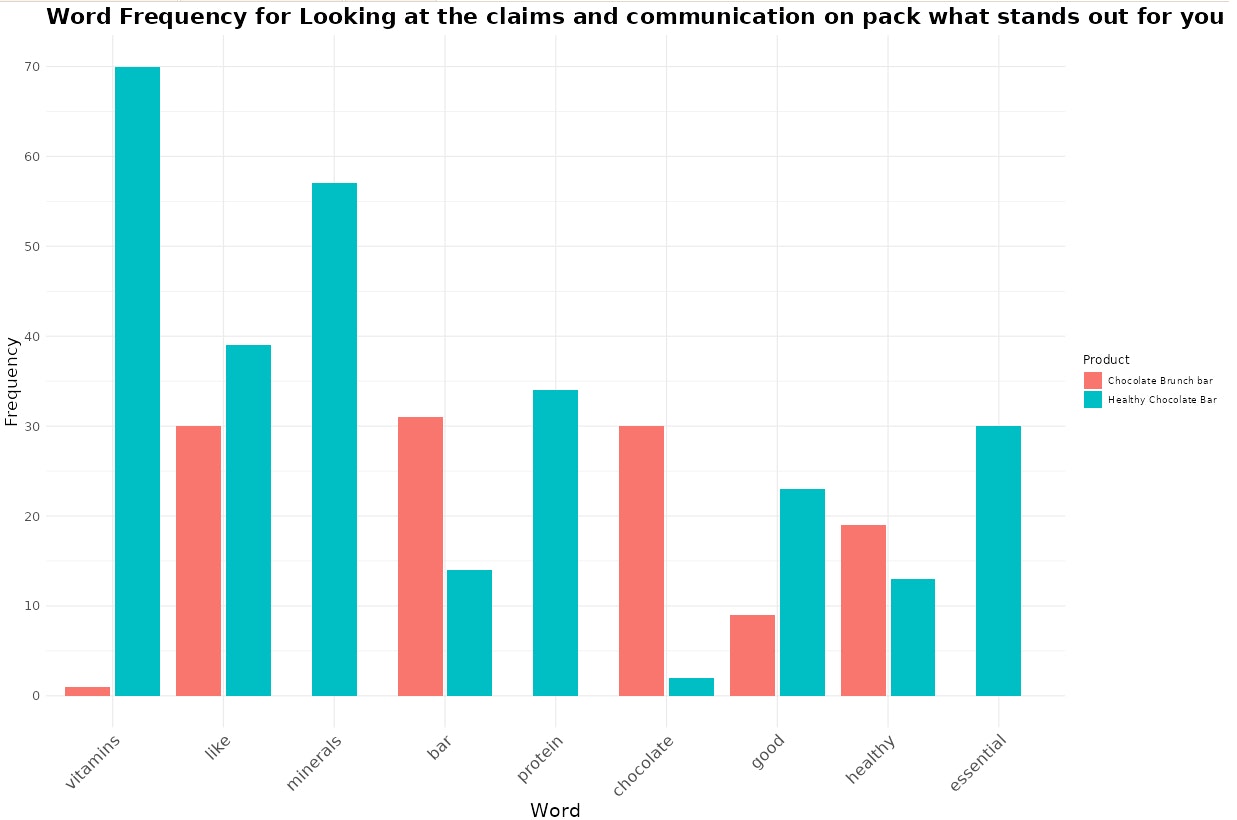
- Word Frequency Bar Charts: Identify the most frequent words in your dataset with clear, easy-to-read bar charts.
- Sentiment Analysis: Gain insights into the emotional tone of your text with sentiment analysis scores. These give an idea of how positive or negative the reviewer felt in their review. Visualize these with outputs such as mean sentiment score bar charts to compare products.
- Summary Statistics: View the summary statistics from the sentiment scores in easy-to-read tables that you can easily export as CSV files.
- Word Frequency Tables: Generate tables of word frequencies for in-depth analysis.
- Heatmaps: Visualize the sentiment scores of each review by viewing them as a scale from red being the most negative reviews and green being the most positive reviews.
- Editable exports to Excel and Powerpoint
PLUS: No download issues or firewalls to worry about – easily access the software via a secure web link unique only to each assigned user.
Access
Upon purchase you will get a unique access to the server where the app is stored, (so no need for extensive installs and permissions) via a username and password. There is also a help file and example to help you use the software initially or you can request a demo.
Select currency
$366.18 – $980.85 (Excluding any applicable taxes)


