SenPAQ
Easy to Use Statistics Software for Analysing Sensory Profiling Data
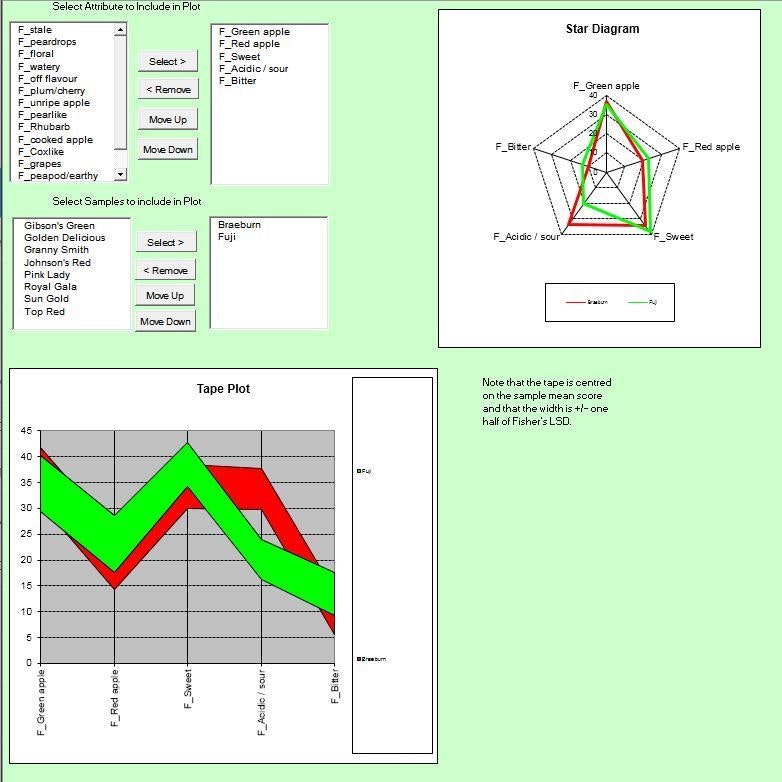
SenPAQ is easy to use statistical software that analyses sensory profiling data from Microsoft Excel and delivers the results as an Excel Spreadsheet (with the option to export charts to Microsoft PowerPoint).
Features
- Customised for analysing sensory profile data
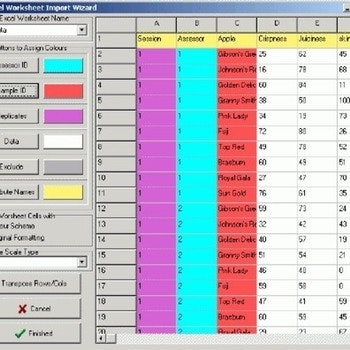
- Data input as Microsoft Excel spreadsheet with simple setup interface
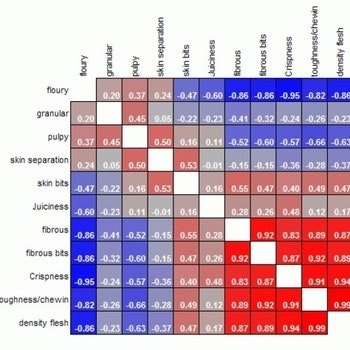
- Has all key univariate analyses for sensory data
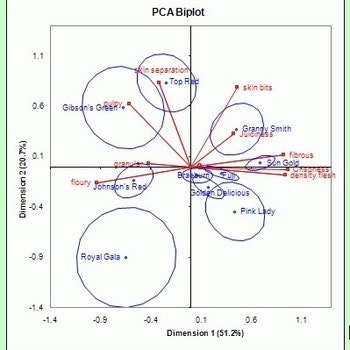
- Plus principal component maps with confidence ellipses
- Outputs analysis to Microsoft Excel
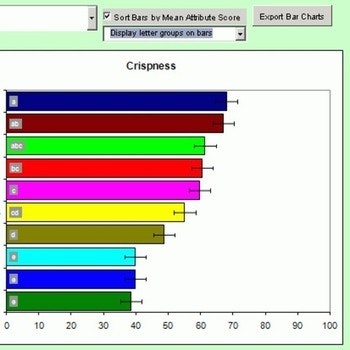
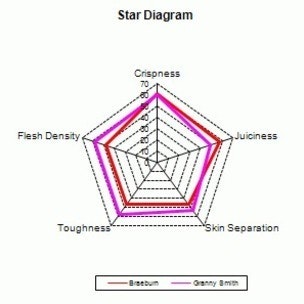
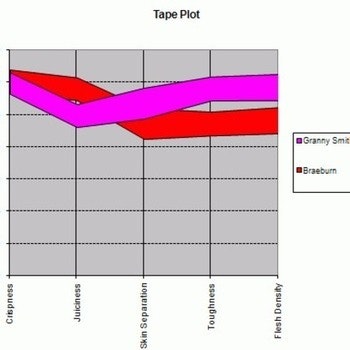
- Outputs charts to Microsoft Powerpoint
- Easy to use
- Copes with Missing Values
Data Input
- Data input from Microsoft Excel spreadsheet with simple column role identification
SenPAQ software
- Easy to exclude data rows or columns
- Customise to your scale type (0-15, 0-100, etc)
- Deals with replicated and unreplicated data
Analysis
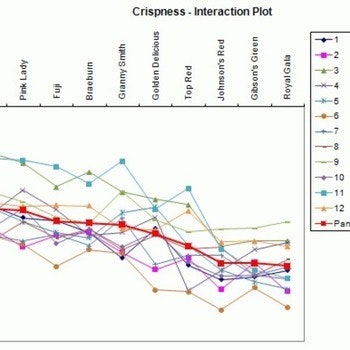
- Analysis of Variance by Attribute (using mixed model)
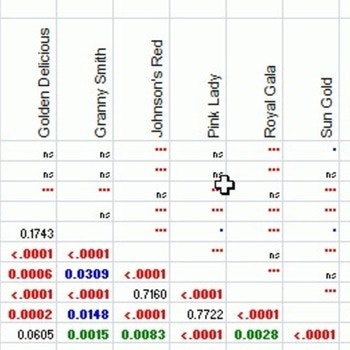
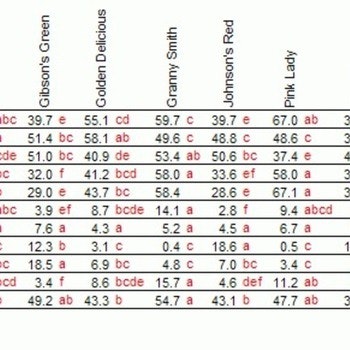
- LSD and Tukey comparisons of sample means, presented as ranked table of means, or significance levels for all pairwise comparisons
E-learning course available: Basic Sensory data analysis using SenPAQ. Get in touch to find out more.
Select currency
£90.00 – £750.00 (Excluding any applicable taxes)


